
The Matter plugin allows you to add, control and monitor Matter-compatible devices directly from Jeedom.
It relies on Matter Server (JS) (Home Assistant project) to communicate with Matter devices via the Matter protocol, and exposes an interface that Jeedom uses to control the devices.
Always re-run dependency installation after updating the Matter plugin.
👉 Plugins → Matter → Configuration → Install dependencies
Then restart the daemon. Failure to do so may cause startup errors or malfunctions.
✨ How it works
The plugin relies on three components:
- Matter Server (JS) — Matter server managing connections with devices
- Node.js daemon (matterd) — bridge between Jeedom and Matter Server (JS)
- Jeedom — user interface, device and command management
The data flow is as follows:
- The daemon queries Matter Server (JS) continuously (polling + WebSocket subscriptions)
- Each state change is transmitted to Jeedom via the plugin's REST API
- Jeedom commands are relayed to the daemon which executes them on the Matter server
The plugin supports two server modes:
- Embedded: the plugin starts and manages Matter Server (JS) automatically
- External: the plugin connects to an existing Matter Server (JS) instance (e.g. Home Assistant)
🔧 Prerequisites
Before installing the plugin and adding a Matter device, make sure you have:
🌐 1️⃣ A stable local network
- Jeedom must be connected to the same network as your devices
- Stable and functional Wi-Fi
- No network isolation between devices
- IPv6 is required for mDNS discovery of Matter devices (can be checked on the Health page)
📡 2️⃣ A Matter controller
Matter requires a controller to manage devices.
The Matter plugin can serve this role and become your primary controller.
⚠️ It is recommended not to use multiple primary controllers in parallel if you are getting started.
🧵 3️⃣ A Border Router (for Thread devices)
Some Matter devices use Thread technology.
In this case, you need a Thread Border Router.
Compatible examples:
- Apple HomePod (2nd generation)
- Apple TV 4K (recent)
- Amazon Echo with Thread support
- Google Nest Hub (2nd generation)
- OTBR dongle (OpenThread Border Router)
⚠️ Matter devices using Wi-Fi or Ethernet do not require a Border Router.
🍎🤖 4️⃣ Devices already configured in Apple, Amazon or Google
If your device is already added in:
- Apple Home
- Amazon Alexa
- Google Home
Two options:
- Either Jeedom becomes the primary controller
- Or you share the device to Jeedom (if supported)
It is advisable to avoid multiple configurations if you are getting started.
🔵 5️⃣ Bluetooth adapter (for Wi-Fi pairing)
Bluetooth is used only during pairing of Matter Wi-Fi devices to transmit network information. It is not required for daily operation nor for Thread or Ethernet devices.
If your Jeedom does not have built-in Bluetooth, you can use a USB Bluetooth adapter (BT 4.0 or 5.0).
Without available Bluetooth, check the Network only option during pairing. This works if the device is already accessible on the local network (Thread devices via Border Router, or Wi-Fi devices already provisioned).
BLE Proxy mode (remote Bluetooth)
If your Jeedom has no Bluetooth but another machine on your network does (Windows PC, Raspberry Pi, Home Assistant…), you can use BLE Proxy mode.
In this mode, the Matter server exposes a WebSocket endpoint ws://<jeedom-ip>:5580/ble to which a remote client connects and proxies all Bluetooth operations (scan, GATT connection, BTP).
Activation:
- In Plugins → Matter → Configuration, Commissioning section, check BLE Proxy (remote)
- Save and restart the daemon
- On the remote machine, launch a compatible BLE Proxy client, for example the Python script available here: https://github.com/Zyg0m4t1k/ble-proxy-client
# Python (Windows / Linux / macOS) — requires: pip install websockets bleak
python ble_proxy_client.py ws://192.168.1.x:5580/ble
BLE Proxy mode and the local Bluetooth adapter are mutually exclusive. Enable one or the other.
🔑 6️⃣ Matter code required
For inclusion, you will need the 11-digit code of your device.
Getting the code from Apple Home
- Open the Home app on your iPhone or iPad
- Long press on the Matter accessory to share
- Tap Accessory Settings (gear icon at the bottom right)
- Scroll down and tap Turn On Pairing Mode
- The app generates an 11-digit numeric code (and sometimes a QR code)
- Tap Copy Code
Getting the code from Google Home
- Open the Google Home app
- Long press on your Matter device tile
- Tap the Settings icon (gear) at the top right
- Tap Linked Matter apps & services
- Tap Link apps & services
- Select Use a pairing code (or "Share with a QR code")
- An 11-digit numeric code is displayed
Getting the code from Amazon Alexa
- Open the Amazon Alexa app
- Tap the Devices tab at the bottom
- Select the Matter accessory to share
- Tap the Settings icon (gear) at the top right
- Select Other assistants and apps
- Tap Add another
- An 11-digit numeric code is displayed
🚀 Installation
Step 1 — Install the plugin from the Market
- Go to Plugins → Plugin Management → Market
- Search for Matter
- Click Install
- Activate the plugin
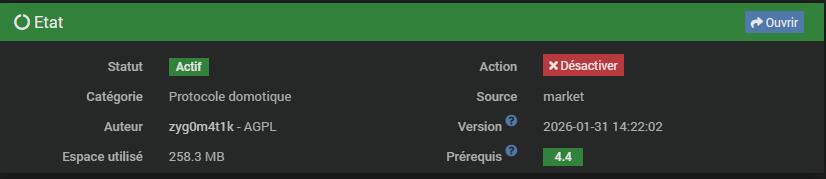
Step 2 — Install dependencies
Dependencies include Matter Server (JS) and modules required for daemon operation. Installation may take 2 to 5 minutes depending on your machine.
- Go to Plugins → Matter → Configuration
- Click Install dependencies
- Wait for the status to show OK before continuing
⚠️ This step automatically installs:
- Node.js (if needed)
- npm dependencies (
matter-server,ws, etc.)

⚠️ Do not reload the page during installation. You can follow progress in the logs.
Step 3 — Start the daemon
- Still in configuration, click Start (Daemon section)
- Wait for the status to turn green ✅

When both the Daemon and Matter Server indicators are green, the plugin is operational.
⚙️ Configuration
Server mode
| Mode | Description |
|---|---|
| Auto (default) | The plugin detects if a Matter server is already active. Otherwise, it starts one. |
| Embedded | The plugin starts and manages Matter Server (JS) itself. |
| External | The plugin connects to an existing instance (e.g. Home Assistant). |
Available settings
| Setting | Default value | Description |
|---|---|---|
| Server mode | auto | See table above |
| Server port | 5580 | Matter Server TCP port (WebSocket) |
| Matter server URL | http://127.0.0.1:5580/ws | WebSocket URL (external mode only) |
| Matter token | (empty) | Authentication token (if required) |
| Daemon port | 55123 | Jeedom daemon HTTP RPC port (Node.js) |
| Bluetooth adapter | auto | BT adapter selection for pairing |
In external mode, enter the WebSocket URL of your Matter server (e.g.
ws://192.168.1.50:5580/ws).
Log level
The plugin log level works on a simple principle:
- The level configured in Jeedom is the reference (native Jeedom selector in Configuration, or Debug/Info/…/Error buttons in the Log level section). This is the persistent value — it is read at each daemon startup.
- Daemon logs (
matterd) and PHP logs (matter) use this level at startup.
The configuration page displays the active level for each component as colored badges:
| Badge | Component |
|---|---|
| Wrapper | Active level in the rpc-wrapper.mjs script |
| Daemon | Active level in the daemon.js process |
| Server | Matter server log level (Python Matter Server) |
The Debug / Info / Notice / Warning / Error buttons change the level live and save it. The active level button is highlighted in blue.
Visual indicator
When logs are in verbose mode (Debug, Info or Notice), an orange banner appears on the plugin main page and an alert is displayed in Configuration as a reminder to switch back to production level.
Everything disappears automatically once the level is set back to Warning or Error.
Fine-grained control per component (Health page)
The Health page allows setting the level of each component independently:
| Target | Persistent | Usage |
|---|---|---|
| Jeedom + Wrapper | Yes — saved | Reference level for next startup |
| Daemon | No — live only | Temporary debug of the daemon.js process |
| Server | No — live only | Temporary debug of the Matter server |
For quick debugging without changing the reference level, use the Daemon or Server buttons on the Health page (persist=no). The level reverts to the reference at next daemon restart.
In production, use Warning or Error to reduce log volume.
➕ Adding a Matter device
Step 1 — Get the pairing code
If the device is already paired with another ecosystem, depending on your configuration:
- Share it from the original application (if the feature is available)
- Or factory reset the device to re-pair it from scratch
Step 2 — Pairing in Jeedom
- Go to Plugins → Matter → Configuration
- In the Commissioning section, paste the Matter code (numeric or
MT:…) - Check Network only if you don't want to use Bluetooth
- Click Commission
- The operation can take up to 3 minutes
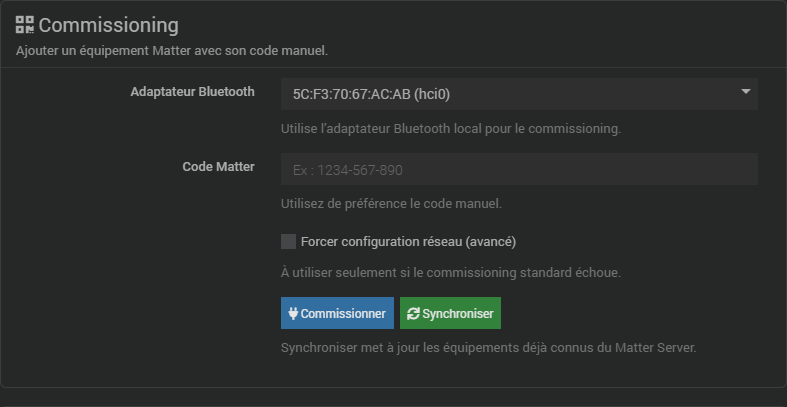
Bluetooth is only needed for Wi-Fi devices during the network provisioning phase. Thread devices or devices already on the network can be paired in network-only mode.
Step 3 — Automatic synchronization
After successful pairing, the plugin automatically synchronizes the Matter node and creates the corresponding Jeedom device.
You can also trigger a manual synchronization via the Synchronize button on the configuration page.
🖥️ Device page
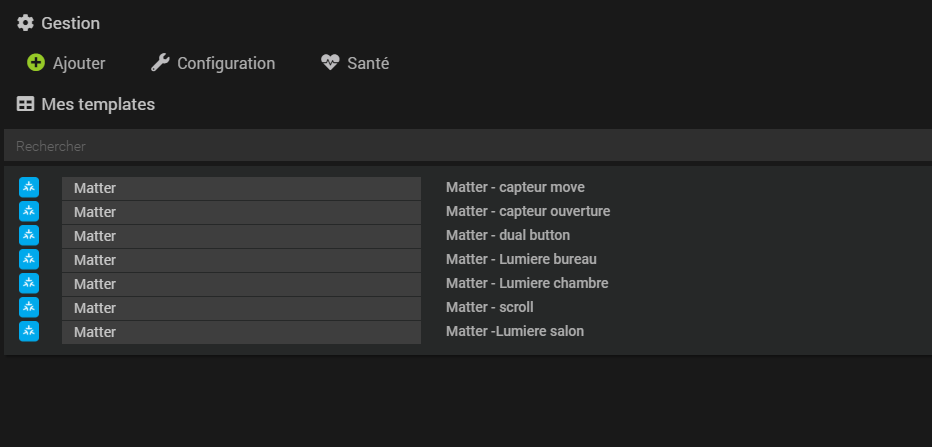
Each Matter device appears as a Jeedom device with two tabs.
Device tab
Contains general information and Matter metadata (read-only):
- Manufacturer / Product: information retrieved from the device
- Device types: detected Matter types (e.g.
OnOff Light,Door Lock) - Clusters: list of Matter clusters present on the device
Debug section
The Device tab contains a Debug section with two buttons:
| Button | Description |
|---|---|
| Advanced node info | Displays a structured view of the Matter node's clusters, attributes and endpoints |
| Raw node dump | Retrieves and displays the complete JSON structure of the Matter node (clusters, attributes, endpoints) |
The Advanced info modal presents data in a readable format by cluster and endpoint. The Raw node dump displays the complete JSON with a Copy button to facilitate sharing in support tickets.
The firmware version and available OTA updates are visible on the Health Page (centralized table of all devices).
Commands tab
List of commands automatically created based on detected clusters.
📊 Commands by device type
Commands are automatically created based on the Matter clusters present on the device.
On/Off bulbs and plugs
| Command | Type | Description |
|---|---|---|
on | Action | Turn on |
off | Action | Turn off |
state | Info | State (0/1) |
Dimmable bulbs
| Command | Type | Description |
|---|---|---|
on / off | Action | Turn on / Turn off |
state | Info | State (0/1) |
setLevel | Action (slider) | Brightness level (0–100%) |
level | Info | Current level |
Color bulbs (Extended Color Light)
All dimmable commands, plus:
| Command | Type | Description |
|---|---|---|
setColor | Action | Set RGB color |
color | Info | Current color (hex) |
setColorTemperature | Action (slider) | Color temperature (in mireds) |
colorTemperature | Info | Current temperature |
ct_cool | Action | Cool preset (~4000 K) |
ct_neutral | Action | Neutral preset (~3000 K) |
ct_warm | Action | Warm preset (~2700 K) |
Smart locks
| Command | Type | Description |
|---|---|---|
lock | Action | Lock |
unlock | Action | Unlock |
is_locked | Info binary | Locked (1) / Unlocked (0) |
lock_state_text | Info text | Readable state (Locked / Unlocked / Jammed) |
lock_state_raw | Info numeric | Raw Matter value (0/1/2/3) |
set_lock_mode | Action | Lock mode |
lock_last_action | Info | Last action (Lock, Unlock…) |
lock_last_source | Info | Source (Manual, Keypad, Remote, Biometric…) |
lock_last_credential | Info | Credential type (PIN Code, RFID, Fingerprint…) |
lock_last_date | Info | Timestamp of last action |
Available modes for set_lock_mode:
Normal— standard operationVacation— enhanced lockingPrivacy— do not disturbNoRemoteLockUnlock— remote command blocking
Environment sensors
| Sensor | Command | Type |
|---|---|---|
| Temperature | temperature | Info (°C) |
| Humidity | humidity | Info (%) |
| Brightness | illuminance | Info (lux) |
| Presence/Occupancy | occupancy | Info (0/1) |
| Contact (door/window) | contact | Info (0/1) |
Thermostats
| Command | Type | Description |
|---|---|---|
local_temperature | Info | Measured temperature |
occupied_heating_setpoint | Info/Action | Heating setpoint |
occupied_cooling_setpoint | Info/Action | Cooling setpoint |
system_mode | Info | Current mode |
Buttons and remotes
Buttons generate event commands based on detected presses:
| Command | Description |
|---|---|
shortPress | Short press |
longPress | Long press |
doublePress | Double press |
Multi-button devices create commands per button (e.g.
button1_shortPress,button2_longPress).
Covers and blinds
| Command | Type | Description |
|---|---|---|
open | Action | Open |
close | Action | Close |
stop | Action | Stop |
position | Info | Current position (%) |
Energy sensors
| Command | Description |
|---|---|
activePower | Active power (W) |
voltage | Voltage (V) |
current | Current (A) |
energy | Energy consumed (kWh) |
Battery
| Command | Description |
|---|---|
battery | Battery level (%) |
batteryVoltage | Battery voltage (V) |
Firmware update (OTA)
Automatically created if the device supports it.
| Command | Description |
|---|---|
ota_update_state | Update state (numeric value, see table below) |
ota_update_progress | Progress in % (-1 if not applicable) |
| Value | Meaning |
|---|---|
| 0 | Unknown |
| 1 | Idle — no update in progress |
| 2 | Querying — querying the OTA server |
| 3 | DelayedOnQuery — deferred retry |
| 4 | Downloading — download in progress |
| 5 | Applying — installation in progress |
| 6 | DelayedOnApply — deferred application |
| 7 | RollingBack — rolling back |
| 8 | DelayedOnUserConsent — waiting for user confirmation |
❤️ Health page
The Health page (Health button on the plugin main page) displays a centralized table of all your Matter devices with their real-time status.
Table columns
| Column | Description |
|---|---|
| ID | Matter node number |
| Name | Jeedom device name |
| Active | Device is enabled in Jeedom |
| Visible | Device is visible in Jeedom |
| Available | 🟢 Reachable / 🔴 Unreachable (real-time) |
| Product | Manufacturer and product name |
| Current firmware | Version installed on the device |
| Update available | Version available via OTA (yellow badge if update available) |
| Last check | Date of last firmware check |
| Matter types | Detected Matter device types |
Available actions
- Refresh: reloads the table
- Check all firmware: launches an OTA check on all devices
- Update (per-row button): triggers firmware update directly from the table, for devices with a newer version available (yellow badge)
The Available indicator (🟢/🔴) reflects the value of each device's available command, updated in real-time by the daemon.
Availability indicator on main page
A green or red dot also appears on each device card on the plugin main page, allowing you to see at a glance which devices are reachable.
🔍 Diagnostic page
The Diagnostic page (Diagnostic button on the main page) displays a complete verification report of the plugin status.
Checks performed
| Check | Description |
|---|---|
| Node.js | Installed and compatible version |
| npm | Node.js package manager available |
| Matter Server (JS) | matter-server module installation |
| Daemon | matterd process status (Node.js) |
| Daemon RPC | Local RPC API availability |
| Matter server connection | WebSocket connectivity to the server |
| Data directory | Storage presence and accessibility |
| Bluetooth | System BT adapter availability |
| IPv6 | IPv6 network configuration (required for mDNS) |
| Docker / OTBR | Container and Thread network status (if enabled) |
Available actions
- Diagnose: refreshes the report
- Auto repair: attempts to automatically fix detected issues
- Pairing mode: activates Bluetooth commissioning mode
IPv6 / Thread diagnostics
The Health page includes advanced checks to identify Thread commissioning issues, particularly useful on VMs and virtualized environments.
IPv6 checks performed
| Check | Description |
|---|---|
ipv6_kernel | IPv6 enabled at kernel level (/proc/sys/.../all/disable_ipv6) |
ipv6_iface | IPv6 enabled on the Matter network interface (default route) |
ipv6_linklocal | Presence of a fe80:: address (minimum required) |
ipv6_global | Presence of a global/ULA address — blocking if absent (Thread commissioning impossible) |
ipv6_forwarding | IPv6 forwarding active = warning (router mode not recommended) |
ipv6_accept_ra | Warning only if accept_ra=0 AND no global/ULA address |
ipv6_nmcli | NetworkManager present and interface managed (blocking if absent) |
ipv6_thread_routes | Thread ULA routes (fdxx::/64) detected via Route Information Options |
Thread route detection
The plugin checks for the presence of Thread routes of the form fdxx::/64:
fd54:cc13:a99f::/64 via ...
fde3:c292:b227:1::/64 via ...
Their presence confirms that Border Router announcements (HomePod, OTBR…) are correctly taken into account. The absence of these routes is often the real cause of impossible Thread commissioning, even when IPv6 seems active.
Automatic fix
If no Thread routes are detected, a Fix button allows automatically applying:
net.ipv6.conf.<interface>.accept_ra_rt_info_max_plen=64
This parameter allows Linux to accept routes announced via Route Information Options (RIO) from Thread Border Routers. It is persistent (added in /etc/sysctl.d/).
Typical VM scenario
On a VM with active IPv6 and functional HomePod/OTBR, Thread commissioning may silently fail if:
accept_ra_rt_info_max_plen = 0 ← Linux default value
After fixing via the Health page:
Thread routes fdxx:: detected → Thread commissioning functional
VM / Docker best practices
- Use a bridge network (avoid NAT)
- Check IPv6 directly in the VM (not just on the host)
- Apply IPv6 settings within the VM itself
- Use
--network=hostfor Docker if Matter Server is containerized - Avoid mDNS reflectors / Avahi that may interfere
Quick CLI diagnostic
# Check Thread routes
ip -6 route | grep "^fd"
If no fdxx::/64 route appears while you have an active Border Router, use the Fix button on the Health page.
🔁 Synchronization
Full synchronization
Launches a resynchronization of all known Matter nodes. Useful after a device firmware update or in case of command drift.
Via configuration:
- Go to Plugins → Matter → Configuration
- Click Synchronize
Single node synchronization
Available directly on the device page if a node needs to be resynchronized individually.
🛠️ Using in scenarios
Matter commands are used like any Jeedom command in your scenarios.
Usage examples:
# Turn on a light
[Living Room][Matter Bulb][on]

# Set brightness to 50%
[Living Room][Matter Bulb][setLevel] = 50

# Check if the door is locked
IF [Entrance][Matter Lock][lock_state] = Locked THEN ...

# Trigger on presence
IF [Hallway][Matter Sensor][occupancy] = 1 THEN ...
🧩 External Server Mode (Home Assistant)
If you already use Home Assistant with an active Matter Server (JS), you can share the same instance:
- In configuration, select Mode: External
- Enter the WebSocket URL:
ws://<home-assistant-ip>:5580/ws - Add the token if necessary
- Save then restart the daemon
⚠️ In external mode, the Matter fabric is shared. Devices already paired in Home Assistant will be visible in Jeedom, but each controller maintains its own commands and states.
🔧 OTBR / Thread (advanced mode)
This section is for users who want to use Thread locally with Jeedom via an OTBR dongle.
📡 Principle
The Matter plugin can work with:
- 🌐 An external Matter server (Home Assistant, etc.)
- 🔌 A local Thread network via OTBR (Docker + dongle)
👉 In this mode, Jeedom becomes autonomous for:
- Thread commissioning
- Thread network management
- communication with devices
🧱 OTBR prerequisites
- Docker installed and functional
www-datauser in thedockergroup- A compatible Thread dongle or hub (see below)
🔌 Thread dongle connection modes
The plugin supports three ways to connect your Thread dongle, depending on your hardware.
OTBR mode
First choose how OTBR operates:
| Mode | When to use |
|---|---|
| Local (USB + Docker) | The dongle is plugged directly into the Jeedom server |
| Remote | OTBR runs on a separate network hub (e.g. SLZB-06xU with built-in OTBR) |
1. USB — Dongle plugged in directly
This is the most common case: your Thread dongle is plugged into a USB port on the Jeedom server.
- The plugin automatically detects available dongles
- Preferably choose the
/dev/serial/by-id/...path (stable, doesn't change on reboot)
Compatible hardware: Sonoff Zigbee Dongle Plus (Thread), SkyConnect, Slaesh CC2652RB, any Thread USB stick
UART settings: most dongles work without additional configuration. If your dongle doesn't connect, use a preset:
| Preset | Hardware |
|---|---|
| Slaesh CC2652RB | Slaesh CC2652RB |
| SLZB Thread RCP (EFR32) | SLZB-06x via USB |
2. TCP via socat — Network Thread dongle (recommended for SLZB)
Your Thread dongle is connected to a network device that exposes its serial port via TCP (Serial-over-IP). The plugin automatically creates a local bridge via socat.
- Enter your device address in
ip:portformat (port 6638 by default) - Example:
192.168.1.10:6638
Compatible hardware: SLZB-06x, SLZB-MR4U and any Serial-over-IP adapter
Mode to enable on the dongle: Thread to remote OTBR
Recommended UART setting for these devices: use the TCP via socat (EFR32/SLZB-MR4U) preset
This mode is more reliable than direct TCP for SLZB devices because socat handles serial protocol conversion.
In Thread to remote OTBR mode, the dongle's REST API (port 8080) is disabled on the dongle itself. A curl http://dongle-ip:8080 that fails is normal and expected in this configuration. Only the serial TCP port (6638) is used.
Jeedom configuration (example SLZB at 192.168.1.147):
| Setting | Value |
|---|---|
| Plugin mode | Local (USB + Docker) |
| RCP connection type | TCP network via socat |
| RCP TCP address | 192.168.1.147:6638 |
| Docker OTBR | Active on Jeedom |
Verifications:
# TCP connection to the dongle — should respond
nc -vz 192.168.1.147 6638

# Thread state in the OTBR container — should show leader, router or child
docker exec -it otbr ot-ctl state
3. Direct TCP — Native network connection (advanced)
Direct connection using spinel protocol over TCP, without intermediary. Reserved for devices compatible with the spinel+hdlc+uart+tcp:// protocol.
Two sub-modes:
- Auto: enter
ip:port, the plugin builds the URL automatically - Full URL: enter the complete spinel URL (e.g.
spinel+hdlc+uart+tcp://192.168.1.10:6638)
4. Remote — OTBR on a network hub (experimental)
OTBR runs on an external device (e.g. SLZB-06xU with "Thread + OTBR on device" enabled). Jeedom connects to its REST API via the HTTP address.
Mode to enable on the dongle: Thread + OTBR running on device
- Select Remote mode in configuration
- Enter the REST API URL of your hub:
http://192.168.1.x:8080 - The plugin reads and writes the Thread dataset directly on the hub
Jeedom configuration (example SLZB at 192.168.1.147):
| Setting | Value |
|---|---|
| Plugin mode | Remote |
| OTBR URL | http://192.168.1.147:8080 |
| Docker OTBR | Stopped on Jeedom |
Verification:
# The dongle's REST API should respond
curl http://192.168.1.147:8080
Important in remote mode:
- The local Docker container is not used
- The local watchdog does not run (unnecessary)
- The Start/Stop/Restart OTBR buttons are disabled
- Thread network management is done from Jeedom, but the hub executes it
Summary table
| Mode | Dongle mode | Docker Jeedom | Port used | Watchdog |
|---|---|---|---|---|
| USB | — | Yes | /dev/ttyUSB* | Yes |
| TCP socat | Thread to remote OTBR | Yes | TCP 6638 | Yes |
| Direct TCP | Thread to remote OTBR | Yes | TCP 6638 | Yes |
| Remote | Thread + OTBR on device | No | HTTP 8080 | No |
⚙️ Installation
From the Configuration → OTBR page:
-
Click Install Thread support
-
Wait for installation to complete (a few minutes)
-
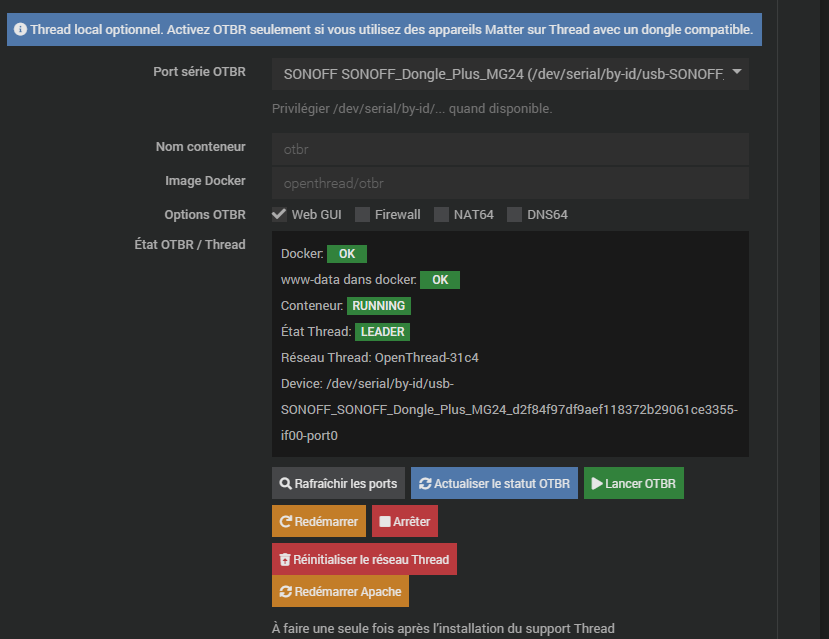
Check the status:
- Docker: OK
- www-data in docker: OK
-
If Docker is not accessible or
www-datapermissions are incorrect: 👉 Click Restart Apache ⚠️ Do this only once after installation -
Click Start OTBR
🌐 Thread network configuration
Two scenarios:
🆕 New Thread network
- Click Create / Reset Thread network 👉 The plugin automatically initializes a new dataset
🔁 Existing network (recommended)
-
Retrieve an existing Thread dataset:
- Home Assistant
- Backup from a previous dongle
-
Open the Matter & Thread Management window
-
Paste the dataset in the designated field
-
Click Inject dataset
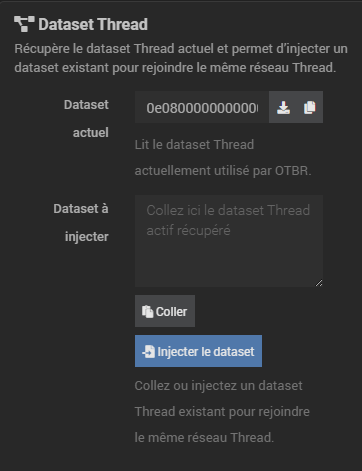
👉 Allows you to:
- keep existing devices
- avoid having to re-pair everything
🔗 Commissioning, multi-admin and dataset
The Matter & Thread Management window groups three main functions:
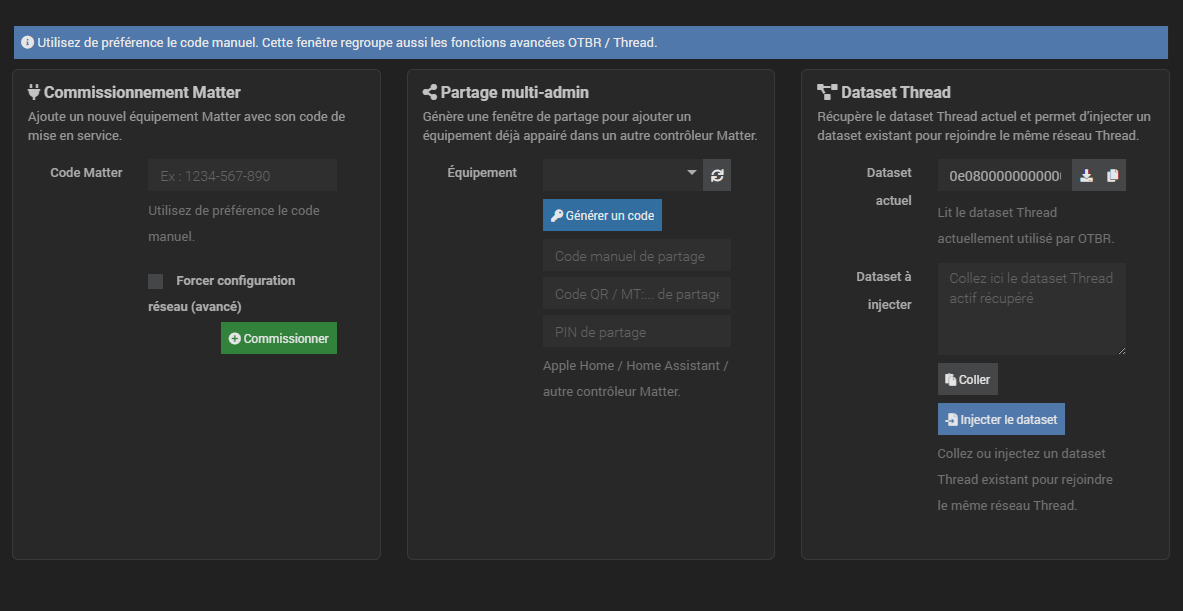
➕ Matter commissioning
Allows adding a new Matter device to Jeedom.
-
Enter the Matter code (manual entry recommended) 👉 Preferably use the manual code (more reliable than QR code)
-
Possible option: force network configuration (advanced)
-
Click Commission
👉 Used to:
- add a new device
- connect a new or reset device
🔄 Multi-admin sharing
Allows adding a device already present in Jeedom to another Matter controller (e.g. Apple Home, Home Assistant)
Steps:
- Select the device in Jeedom
- Click Generate a code
- Use this code in the other ecosystem
👉 Allows:
- avoiding a reset
- sharing a device between multiple systems
👉 Requires controllers to be on the same Thread network
🧠 Important difference
- Commissioning → initial addition of a device
- Multi-admin → sharing an existing device
👉 Both methods are complementary and can be used together
📋 Thread dataset
The dataset contains:
- network keys
- network name
- Thread configuration
👉 The dataset is the central element of the Thread network: all controllers must share the same one
Available functions:
- 📥 Retrieve current dataset
- 📋 Copy
- 📤 Inject a dataset
📡 Thread channel
The Thread channel is the radio channel used by all devices on your network. It is stored in the active dataset and must be identical on all nodes.
Changing the channel affects all Thread devices on the network. The operation is reversible via backup restoration, but may temporarily disconnect some devices.
Read current channel
From Configuration → OTBR, click the 🔄 icon next to the Thread Channel field to read the currently active channel.
Change the channel
- Enter the new channel (allowed values: 11 to 26)
- Click Change
- Confirm the warning
Behavior depends on the OTBR role in the Thread network:
| OTBR role | Mechanism | Delay |
|---|---|---|
| Leader | dataset commit pending — propagated directly | ~30 seconds |
| Router | dataset updater start — submitted to network Leader | ~5 minutes |
If another border router (HomePod, Apple TV 4K, Google Nest Hub…) is Leader of your Thread network, OTBR is in Router mode. The channel change is submitted to the Leader via MGMT_PENDING_SET.req — switching takes ~5 minutes if the Leader accepts it.
Backup and restore
Before any modification, the plugin automatically backs up the active dataset in Jeedom configuration.
| Action | Description |
|---|---|
| Save dataset | Opens the Matter & Thread Management window to manually copy the dataset |
| Restore backup | Re-injects the dataset saved before the last channel change |
Use the Save dataset button before any channel change. In case of issues, Restore backup allows reverting to the previous state in seconds.
Thread channel change from the interface now works whether your OTBR is Leader or Router. In Router mode, switching takes ~5 minutes (network propagation delay). Check the channel with Read channel after this delay.
💡 Tip
👉 Prefer using an existing dataset if you already have a Thread network 👉 This ensures continuity and avoids losing devices
🧠 Best practices
- Always use a single Thread network
- Make a dataset backup
- Reuse the dataset when changing dongles
⚠️ Important
- Bluetooth is only used for commissioning
- Once added, the device communicates via Thread (IP network)
- If the dongle is replaced → re-inject the dataset
- If the dataset is lost → devices will need to be re-paired
🔄 Device synchronization
- Devices are automatically detected after commissioning
- A synchronization can be launched manually if needed
🛡️ Automatic monitoring (Watchdog)
The plugin includes a monitoring system that runs in the background as soon as OTBR is started. It checks every 30 seconds that everything is working correctly.
What it monitors
| Detected situation | Automatic action |
|---|---|
| The OTBR container has stopped | Container restart (after 60s) |
| The container has disappeared or is unrecoverable | Complete container recreation |
The Thread network is lost (detached) | Thread layer restart |
| The Thread network is disabled | Thread network relaunch |
Jeedom cron role
The Jeedom scheduled task (executed every minute) only checks that the watchdog itself is running. If the watchdog has stopped for any reason, Jeedom automatically relaunches it.
Jeedom (cron 1 min)
  └─ Watchdog active? No → relaunch watchdog
       └─ Watchdog (every 30s)
            └─ OTBR OK? No → restart OTBR
After a complete recreation
If the OTBR container had to be entirely recreated (rare case), the Thread network restarts without your dataset. Your Thread devices may not reconnect.
Solution: Go to Matter & Thread Management → Inject dataset and paste your backup dataset.
Remember to copy your Thread dataset regularly from Matter & Thread Management → Retrieve current dataset. It's your "key" to recover your Thread devices in case of issues.
🐛 Troubleshooting
The daemon won't start
- Check that dependencies are properly installed (OK status)
- Check logs
log/matterdto identify the error - Verify that port
55123(daemon RPC) is not in use - Use Auto repair on the Health page
Pairing fails
- Check that the Matter code is correct (11 digits or
MT:…format) - Make sure the device is in commissioning mode (blinking LED)
- Try with the Network only option unchecked (to enable Bluetooth)
- Increase the timeout if the device is slow to respond (default 180s)
- Check that IPv6 is active on your network (Health page)
The device is created but doesn't respond
- Check that the device is powered and on the same network
- Launch a manual Synchronization
- Check logs
log/matterfor RPC errors - Verify connectivity with the Matter server from the Health page
Commands are not created
- Check the detected clusters in the Device tab
- Relaunch a full synchronization
- If the issue persists, delete the device and re-synchronize the node
If expected commands are not created after synchronization, use the buttons in the Debug section (Device tab):
- Node info: structured view of detected clusters and attributes
- Raw node dump: complete node JSON with Copy button
Attach the dump content to your support ticket for analysis.
OTBR won't start (USB dongle not detected)
- Check that the dongle is plugged in: go to Configuration → OTBR and click Refresh ports
- Prefer the
/dev/serial/by-id/...path if available (more stable) - If the dongle doesn't respond, try a UART Preset (Slaesh CC2652RB or SLZB Thread RCP)
- Check the matter_otbr logs to see the exact error
OTBR doesn't connect (TCP socat or direct TCP mode)
- Check that the
ip:portaddress is correct (port 6638 by default for SLZB) - Test that the device is reachable on the network
- For SLZB: verify that "Serial-over-IP" or "Thread RCP" mode is enabled in the device interface
- If connection fails, try the UART preset
TCP via socat (EFR32/SLZB-MR4U) - Check the matter_otbr logs
Remote hub (Remote mode) is unreachable
- Check the REST API URL:
http://hub-ip:8080 - Verify that your hub has OTBR mode enabled
- Test the URL in a browser: you should see a JSON response
- Check that there's no firewall between Jeedom and the hub
OTBR has stopped and won't restart
The watchdog normally handles this case automatically. If OTBR remains stopped:
- Check the matter_otbr logs to see what happened
- Verify that Docker is working on the machine
- Go to Configuration → OTBR and click Start OTBR manually
- If the watchdog itself is stopped, wait up to 1 minute for Jeedom to automatically relaunch it
Thread devices no longer respond after an OTBR restart
If OTBR had to be entirely recreated (rare case), the Thread dataset has been lost:
- Go to Matter & Thread Management → Inject dataset
- Paste your backup dataset
- Click Inject dataset
- Wait a few seconds for devices to reconnect
After dependency update
After each major dependency update:
- Stop the daemon
- Re-run dependency installation
- Restart the daemon
- Check the Health page
📋 Compatible devices
The plugin supports any Matter 1.x certified device, including:
- Bulbs and spotlights (on/off, dimmer, color)
- Smart plugs
- Smart locks
- Temperature and humidity sensors
- Brightness sensors
- Presence / motion detectors
- Contact sensors (door, window)
- Thermostats
- Covers and blinds
- Buttons and remotes
- Energy meters
🎉 Conclusion
The Matter plugin offers a complete integration of the Matter protocol in Jeedom:
- Automatic discovery of each device's capabilities via clusters
- Automatically generated commands based on detected features
- Built-in monitoring with the Health page and logs
- Compatible with existing installations (external server mode)
Installation → Pairing → Use in your scenarios and Jeedom dashboard.