
📋 Overview
The Speedtest plugin lets you run internet speed tests from your Jeedom box and log the results over time. It measures download, upload, ping, jitter and packet loss, then calculates an overall score and a usage rating (streaming, gaming, video calls, browsing).
It relies on speedtest-cli installed in a Python virtual environment (venv).
✨ Features
- Download and upload speed measurement in Mbit/s
- Ping (latency) measurement in ms
- Jitter (latency variation) measurement in ms
- Packet loss measurement in %
- Overall score out of 10, weighted (download 40%, upload 20%, ping 20%, jitter 10%, loss 10%)
- Usage rating: web, streaming (SD/HD/4K), gaming, video conferencing
- Test server and ISP identification
- Custom SVG widget with animated download gauge, upload bar, score circle and metric tiles
- Scheduling via configurable cron
- Server selection: automatic or manual by ID
- IP monitoring: alert on public IP address change
⚙️ Prerequisites
- Jeedom 4.4 minimum
- A working internet connection
- Plugin dependencies installed (Python 3, speedtest-cli in a venv)
📥 Installation
- Install the plugin from the Jeedom Market or via GitHub
- Activate the plugin
- Go to Plugins > Plugin Management > Speedtest
- Click Install dependencies and wait for completion
- Verify that the dependency status shows OK
🔧 Plugin Configuration
In the plugin configuration page (Plugins > Plugin Management > Speedtest > Configuration):
| Option | Description |
|---|---|
| Check IP address | Enables hourly monitoring of your public IP. If the IP changes, an alert is logged |
| IP Address | Displays the detected public IP (filled automatically) |
🖥️ Equipment Configuration
From Plugins > Monitoring > Speedtest, click Add to create an equipment, then configure it:
Equipment Tab
Standard Jeedom options: name, parent object, category, enable, visible.
Configuration Tab
| Option | Description |
|---|---|
| Enable Cron | Enables automatic test scheduling |
| Refresh frequency | Cron expression for the frequency (e.g., 0 */4 * * * for every 4 hours). Click ? to use the cron assistant |
| Server ID (optional) | speedtest.net test server identifier. Leave empty for automatic best server selection |
| Max Download scale (Mbit/s) | Maximum value for the download gauge on the widget (default: 1000) |
| Max Upload scale (Mbit/s) | Maximum value for the upload bar on the widget (default: 500) |
Adjust the max scales to match your internet plan so the widget gauges are readable. For example, for a 1 Gbit/s fiber connection, leave 1000. For an ADSL connection, set 30.
📡 Commands
Commands are created automatically when saving the equipment:
Numeric Info Commands
| Command | Unit | Description |
|---|---|---|
| Download | Mbit/s | Download speed |
| Upload | Mbit/s | Upload speed |
| Ping | ms | Network latency |
| Jitter | ms | Latency variation (stability) |
| Packet Loss | % | Percentage of lost packets |
| Score | /10 | Weighted overall connection score |
Text Info Commands
| Command | Description |
|---|---|
| Server | Name and sponsor of the test server used |
| ISP | Detected Internet Service Provider |
| Usage Rating | Assessment by usage type (web, streaming, gaming, video calls) |
Binary Info Command
| Command | Description |
|---|---|
| Status | 1 = test succeeded, 0 = test failed |
Action Command
| Command | Description |
|---|---|
| Refresh | Manually triggers a speed test |
All numeric commands can be historized to track your connection performance over time. Enable historization in the Commands tab of the equipment.
🎨 The Widget
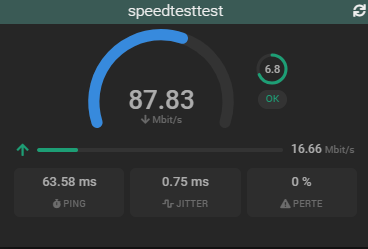
The plugin features a custom widget with:
- An animated half-circle gauge for download (blue)
- A progress bar for upload (green)
- A score circle /10 (green)
- A status badge (OK / Error)
- Three tiles for ping, jitter and packet loss
- A refresh button to trigger a test on demand
The gauge scales (download and upload) are configurable in the equipment's Configuration tab to match your connection type.
🏆 Understanding the Score
The overall score is calculated out of 10 by weighting the metrics:
| Metric | Weight | Excellent | Good | Average |
|---|---|---|---|---|
| Download | 40% | > 100 Mbit/s | > 25 Mbit/s | > 10 Mbit/s |
| Upload | 20% | > 50 Mbit/s | > 20 Mbit/s | > 10 Mbit/s |
| Ping | 20% | < 10 ms | < 20 ms | < 50 ms |
| Jitter | 10% | < 2 ms | < 5 ms | < 10 ms |
| Packet Loss | 10% | 0% | < 1% | < 3% |
📊 Understanding the Usage Rating
The Usage Rating command evaluates your connection for different use cases:
| Usage | Excellent | Good | Insufficient |
|---|---|---|---|
| Web | DL > 5 Mbit/s + Ping < 100 ms | DL > 1 Mbit/s | DL < 1 Mbit/s |
| Streaming | DL > 25 Mbit/s (4K) | DL > 10 Mbit/s (HD) | DL < 3 Mbit/s |
| Gaming | DL > 10 + Ping < 20 ms | DL > 5 + Ping < 50 ms | Ping > 100 ms |
| Video Calls | UL > 3 + DL > 5 + Ping < 50 ms | UL > 1 + DL > 2 | Otherwise |
💡 Usage in Jeedom
Plugin commands can be used in:
- Scenarios: trigger actions if speed drops below a threshold, or if the score falls below 5/10
- Dashboard: widget display with all metrics
- Alerts: notification on connection degradation
- History: track performance evolution over time
Scenario Example
If the Score command < 3, then send a message "Internet connection degraded (score: #[Living Room][Speedtest][Score]#/10)"
🛠️ Troubleshooting
Dependencies won't install
- Check that your Jeedom box has internet access
- Check the
speedtest_updatelog in Analysis > Logs - Verify that Python 3.8+ is available on your system
Test fails (status = 0)
- Check your internet connection
- Check the
speedtestlog in debug mode to see the raw output - If you specified a server ID, try leaving it empty (automatic selection)
Values seem incorrect
- Jitter and packet loss are measured via
pingon the test server. A firewall blocking ping may skew these values - Download and upload are in Mbit/s (megabits per second), not MB/s
Widget doesn't display correctly
- Verify that your Jeedom is version 4.4 minimum
- Clear your browser cache (Ctrl+Shift+R)
- Save the equipment to recreate the commands